Earth Overshoot Days: Lessons in comparing 2019 to 2020.
Montreal,
Sept 16th, 2020
This year Earth Overshoot Day (EOD) carries lessons we’ve not seen in years before. Of course, the news of EOD has always come as a sullen reminder of humanity’s impact on our living environment, but this year the message comes with hope.
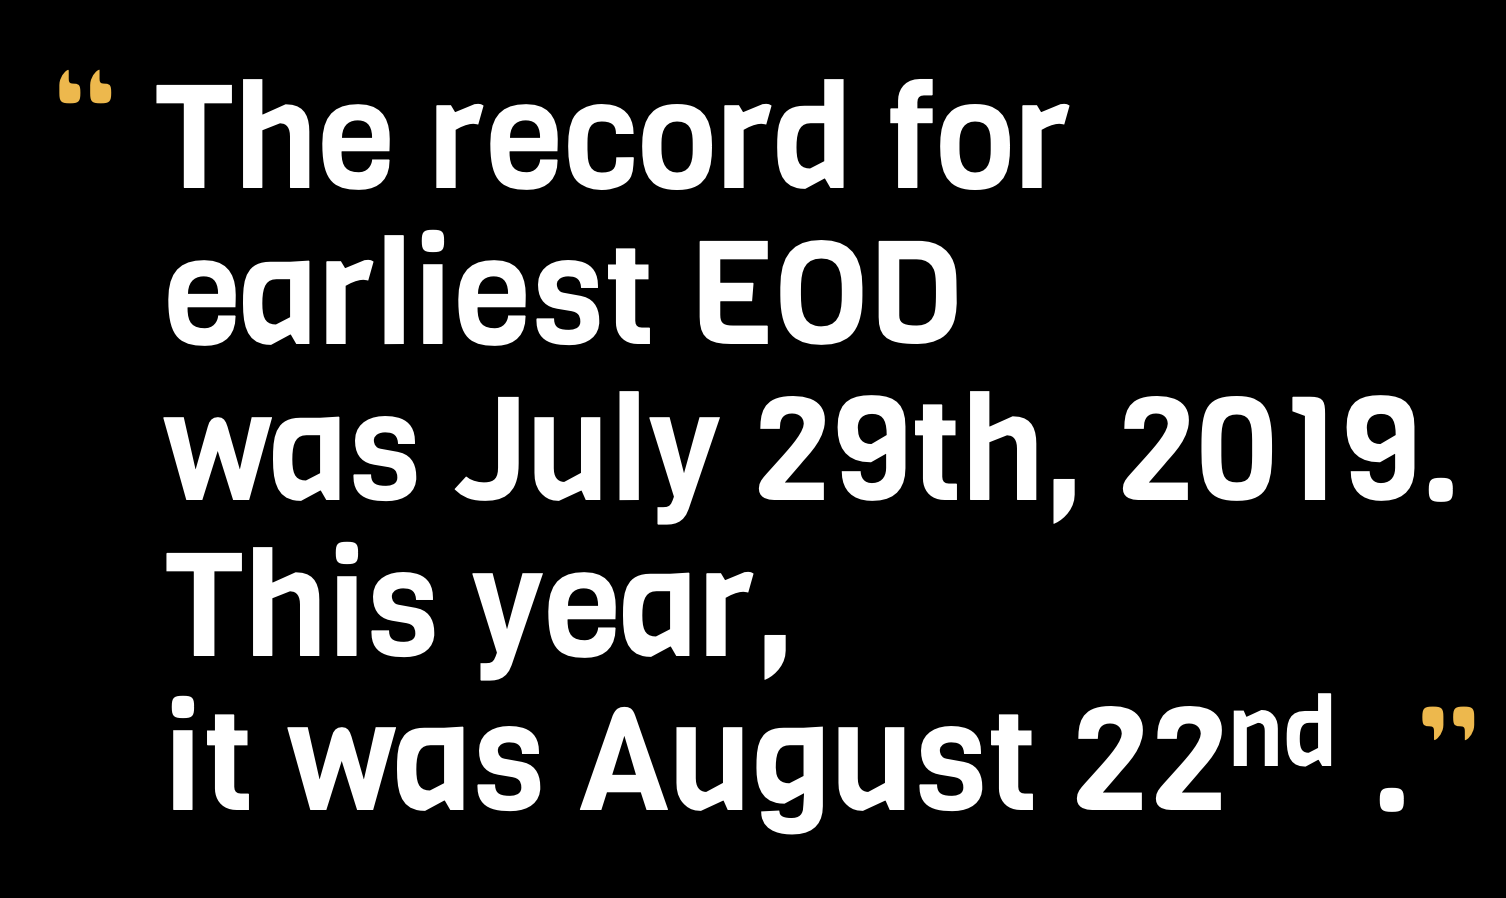
EOD is a concept developed in 1970 by the Global Footprint Network, the first year humanity overshot the boundaries of the earth’s ability to replenish itself for the entire next year. The record for earliest EOD was July 29th, 2019. This year, it was August 22. But we should take this year’s downturn with cautious optimism. There are two main lessons to be drawn from COVID’s temporary shutdown of our economies and the later arrival of EOD.
First, the global EOD differs from individual country’s EODs. Of the 136 countries with available data, some of the countries nearest to the top of the list are Qatar, Luxembourg, UAE, Kuwait, Bahrain, Trinidad and Tobago, US, and Canada with EODs in March 2020. Meaning that from January to March 2020, these countries used resources equivalent to what the planet can regenerate over the whole calendar year. Nearest to the bottom are Morocco, Indonesia, Niger, Myanmar, and Kyrgyzstan with EODs in late December.
Many factors contribute to the EODs of these countries. At first glance, a few differentiating factors standout immediately. For example, most of the countries at the top of the list are oil-producing. But this isn’t true for all. We often differentiate carbon emitting countries based on general wealth of the population or whether the nations energy supply runs mainly on fossil fuels or on renewables. But ultimately when we measure carbon emissions per capita, we end up with a completely different outlook than when carbon emissions are measured per country, regardless of population.
Per capita measurements provide insights into systemic problems causing high carbon emissions in countries with smaller populations. Trinidad and Tobago and Qatar rate in the top 5 countries for carbon emissions despite a small population, due to power generation and heavy infrastructure. Compared to China, which contributes 40% of the global carbon emission totals and who’s industry runs mostly on coal, but provides manufacturing for most of the goods in the developed world. There’s a gap there. Where China produces 50% more carbon than the US, it’s per capita measurement is only a third of Qatar or Trinidad and Tobago. So what’s the catch?
Overall, the population of a country has little bearing on the country’s carbon emissions as long as a society is powered on fossil fuels and old, inefficient infrastructure. It’s like comparing a new and an old car. Sure, you’ll use a bit more gas when the load in your car is different but ultimately, there’s still a basis of efficiency and exhaust that’s not going to change if you have one person or four in the vehicle. The old vehicle, like the old infrastructure and power generation, will always be more intensive on the environment.
From 2019 to 2020, the top rated countries in EODs remains nearly unchanged. While top cited causes for a global downturn in carbon emissions have been traffic, less air travel, and lower consumption patterns, we see that these have little impact on our overall exhaustion of global resources on a per capita scale. COVID has shown that there are bigger, more systemic issues at play producing carbon emissions and that measuring per capita emissions, while useful to some applications, misses the point of the global industries we are working to adapt.
The second major takeaway is the other side of the coin: Global industry is the culprit and potential hero when it comes to lowering carbon emissions overall. With an overall 14.5% decrease in carbon footprint and an 8.4% decrease in forest products globally this year, we see again that land use and change has a massive impact on the environment – not only because of the carbon emissions output by the forestry industry itself but the opportunity cost, so to speak, of the carbon emissions that would have been sequestered had that land not been changed or developed.
With these decreases, we scaled the EOD back by 3 weeks this year. At this rate, we’re looking at a reduction of 58%-60% of pre-COVID carbon emission levels in order to eliminate Earth Overshoot Day and live symbiotically with nature again. Taking the lessons of COVID’s economic shutdown, in order to return greener we need to develop alternative energies, modernize infrastructure, and empower global industries to transform their operations and activities. This is how we will continue to scale forward our EOD from here forward.


